This article also appeared on read . cash and my website.
On August 1, 2017, the Bitcoin Cash (BCH) hard fork occurred, raising the permitted bitcoin block size above 1MB and creating a separate history of transactions from that point forward. At the moment of the hard fork, all self-custody owners of BTC were endowed with an equal amount of BCH that they could spend with their private cryptographic keys. Owners of BTC on exchanges were at the mercy of the exchanges’ decisions to allow trading or withdraw of BCH.
Owners of pre-fork BTC could choose to spend only their pre-fork BTC, only their pre-fork BCH, spend both, or do nothing at all. When I use “spend” in this post I mean transact with the coins on the blockchain. Coin owners could be sending to themselves, spending it on a good or service, sending it to an exchange to withdraw, or performing “wallet maintenance” if the owner is an exchange. Therefore, the blockchain data cannot tell us definitively whether certain pre-fork coins have changed ownership due to possible self-spending behavior. However, we can conclude that any self-custody coins that have not been spent on the blockchain have not been sold. Of course, it is widely believed that a large share of early bitcoins are now unspendable due to their corresponding private keys being lost.
With those caveats out of the way, let’s go to the analysis, which was generously funded by u/moleccc.
Analysis
The research process was fairly simple. From BTC and BCH full nodes I extracted data on all transaction outputs, their corresponding bitcoin value, and the time (block height) they were created. An output is a concept closely related to – but distinct from – address. An output is identified by its transaction ID plus its position in the transaction outputs, i.e. first position, second position, third position, etc. Once an output is spent by another transaction, it is spent permanently and cannot be reused. However, an address can be re-used repeatedly. With each address re-use, a unique output would still be created. If I were to carry out the analysis with addresses rather than outputs, then spent pre-fork coins could “come alive” again later in the blockchain history, which would lead to false conclusions. Therefore, the correct unit of analysis is the output.
I checked all pre-fork outputs for whether they had been spent prior to the fork. The outputs that remained unspent at the time of the fork constituted all BTC and BCH in existence at that point in time. Those funds were the unspent transaction output (UTXO) set at the time of the fork. Then I simply checked if and when each of these pre-fork outputs had been spent in a transaction on the post-fork BTC and BCH blockchains.
Here are the main results for the spent status of pre-fork bitcoin by bitcoin value (i.e. what appears on the blockchain rather than its fiat valuation) as of March 31, 2022:
| BTC | BCH | Bitcoin Value | Percent |
|---|---|---|---|
| Unspent | Unspent | 4,356,697 | 26.4% |
| Spent | Unspent | 1,342,945 | 8.1% |
| Unspent | Spent | 264,379 | 1.6% |
| Spent | Spent | 10,515,129 | 63.8% |
Almost two-thirds of the value of pre-fork bitcoin has been spent on both the BTC and BCH blockchains. About one-quarter has not been spent on either blockchain; the private keys to many of those coins are probably lost forever, rendering the coins unspendable. By a 5-to-1 ratio more pre-fork bitcoin by value has been spent on the BTC blockchain but remained unspent on the BCH blockchain than bitcoin spent on BCH but unspent on BTC.
A stacked area chart of the trend over time with some key events is below: (click image to expand)
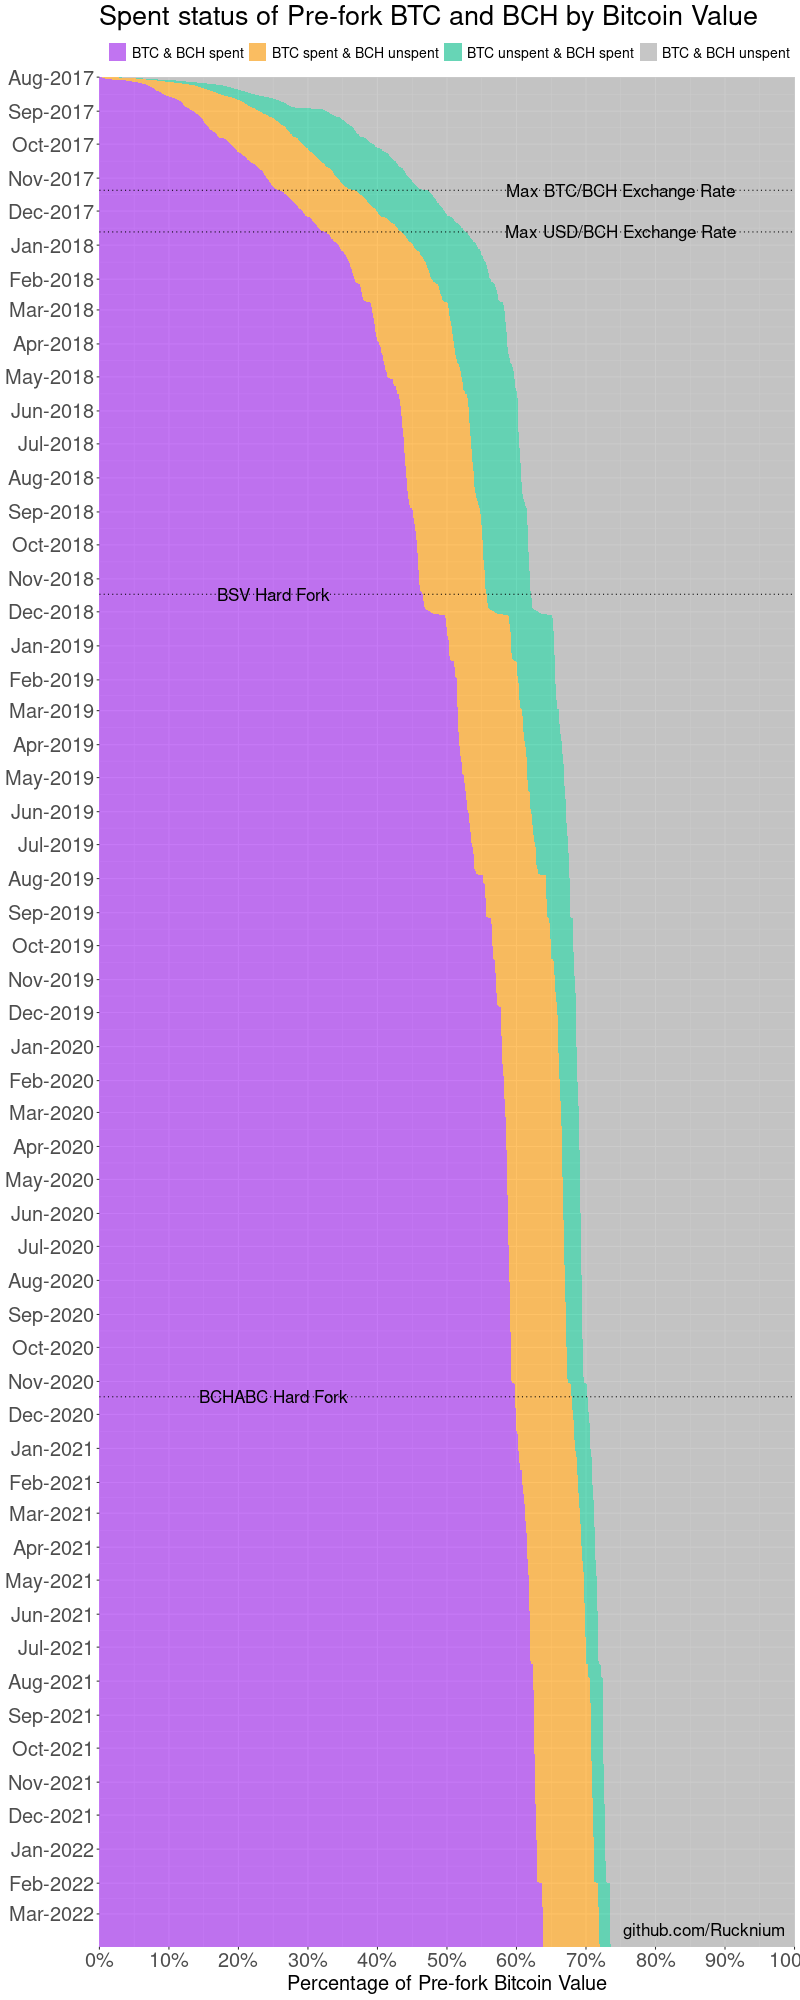
A large share of pre-fork bitcoin was rapidly spent in the first few months after the fork. After that, the rate of spending flattens out. In the early months there is almost an equal share of coins that are orange (BTC spent & BCH unspent) and green (BTC unspent & BCH spent), but over time the green share shrinks. There is a sudden jump in spending a few weeks after the BSV/BCH hard fork.
Instead of by value, we can also analyze spending behavior by number of outputs. This gives each output equal weight regardless of how large or small the bitcoin value of those outputs are, possibly giving better insight into the behavior of typical users rather than the few users and institutions that owned a large amount of bitcoin. On the other hand, very small amounts that are not worth transacting – dust – are also given equal weight in such an analysis.
The main results for the spent status of pre-fork bitcoin by number of outputs as of March 31, 2022:
| BTC | BCH | Number of outputs | Percent |
|---|---|---|---|
| Unspent | Unspent | 24,296,821 | 45.3% |
| Spent | Unspent | 7,934,988 | 14.8% |
| Unspent | Spent | 808,870 | 1.5% |
| Spent | Spent | 20,617,669 | 38.4% |
Compared to the results by bitcoin value, a much greater proportion of outputs have been left unspent. In particular, the percentage of outputs that have remained “orange” (BTC spent & BCH unspent) rather than “green” (BTC unspent & BCH spent) is much larger. This may be a consequence of the lower fiat-denominated value of BCH compared to BTC. It may be worth it to move a small quantity of BTC, but not an equivalent quantity of BCH.
A stacked area chart of the trend over time is below:
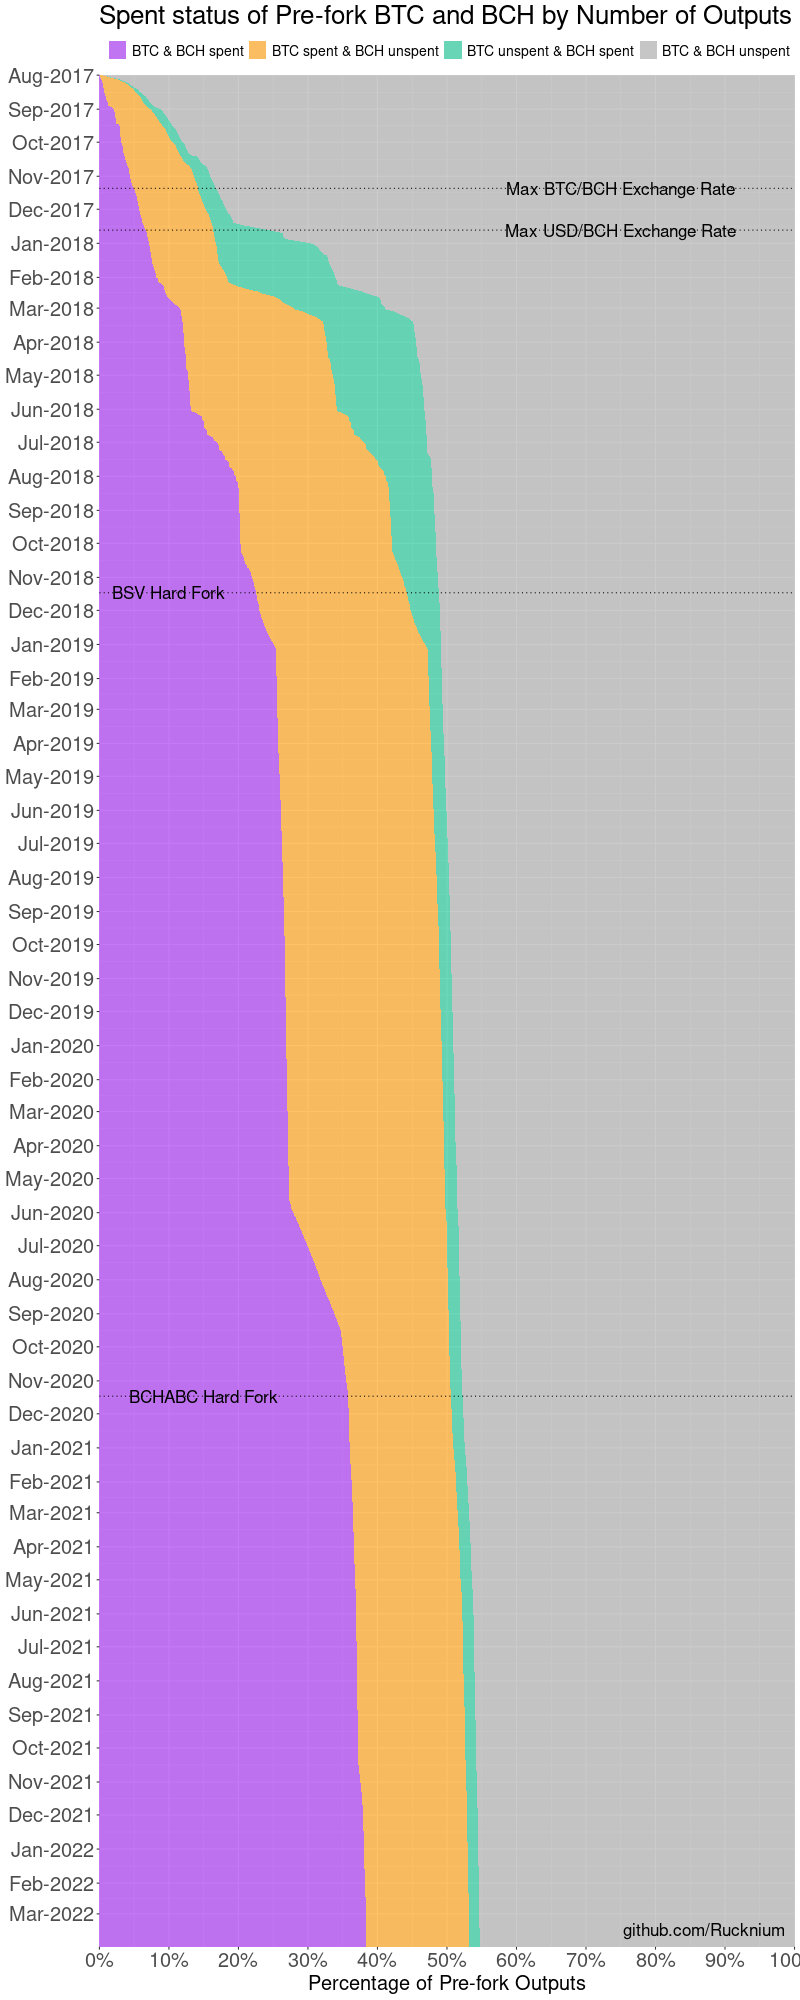
In this chart we can more clearly see the phenomenon of the green area (BTC unspent & BCH spent) rising substantially near the point of maximum USD/BCH exchange rate in December 2017. This may indicate that owners of pre-fork bitcoin may have been moving their BCH – but not their BTC – to take advantage of the high exchange rate and sell BCH for fiat currency. Over the following 12 months, the green area shrinks, indicating that those users who moved their BCH eventually also moved their BTC as well. Another notable feature of the chart is the depletion of the orange area (BTC spent & BCH unspent) over the second half of 2020, indicating that those users who had previously spent their BTC eventually spent their BCH as the cryptocurrency exchange rate was recovering after the early-COVID crash.
State Transition Analysis
The tables and plots above give a broad overview of the dynamics of pre-fork output spending on the BTC and BCH blockchains. They tell us the status of outputs at any given time. However, they do not tell us in detail how outputs are transitioning between the different “states” of being spent on neither chain, only one of the chains, or both chains. The diagram below illustrates the four different states that an output can go through and the five transition types it can experience.

An output can take three separate paths to arrive at the state of being spent on both chains. It can first be spent on the BTC blockchain and then the BCH blockchain. That is the path on the left side of the diagram. It can first be spent on the BCH blockchain and then spent on the BTC blockchain, which is the path on the right. The last option is to be spent simultaneously on the BTC and BCH blockchains, which is the middle path in the diagram.
For brevity, each state is represented by initials: (FF), (TF), (FT), (TT). “F” is for “Spent: False” and “T” is for “Spent: True”. The first position corresponds to BTC and the second position corresponds to BCH. Thus, “(TF)” means that the pre-fork output has been spent on the BTC blockchain, but not the BCH blockchain.
Below is a set of line charts displaying the value of outputs transitioning between each state for each day since the fork. In the chart, a spend on the BTC and BCH blockchains is defined as simultaneous (FF to TT) if it occurred on the same date, using the UTC time zone. The keys dates from the previous two charts are still marked with dotted lines, but the labels are omitted to avoid cluttering the chart.
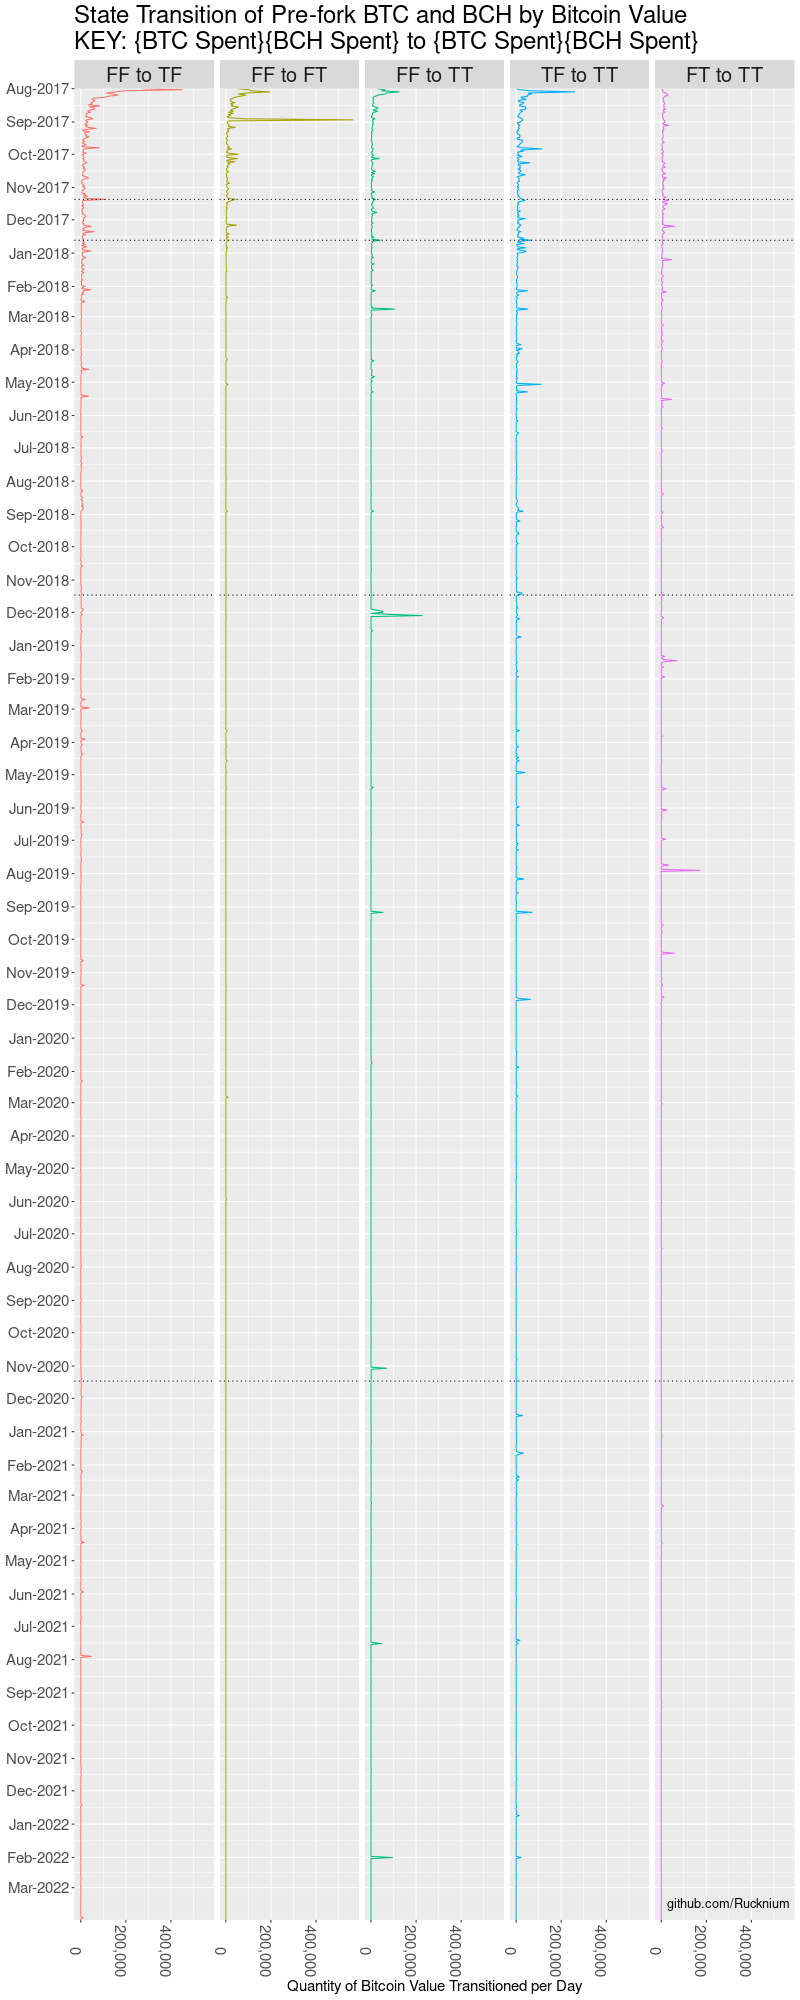
The heaviest spending in bitcoin value terms occurred in the first few days after the BTC/BCH fork. The highest single-day spike was in late August 2017 when over 500,000 BCH was spent before the corresponding BTC. This plot also shows that the spike in spending two weeks after the BSV hard fork occurred due to simultaneous spends on the BTC and BCH blockchains. The small spike before the BCHABC hard fork was also due to simultaneous BTC and BCH spending.
The corresponding plot for number of outputs rather than bitcoin value is below:
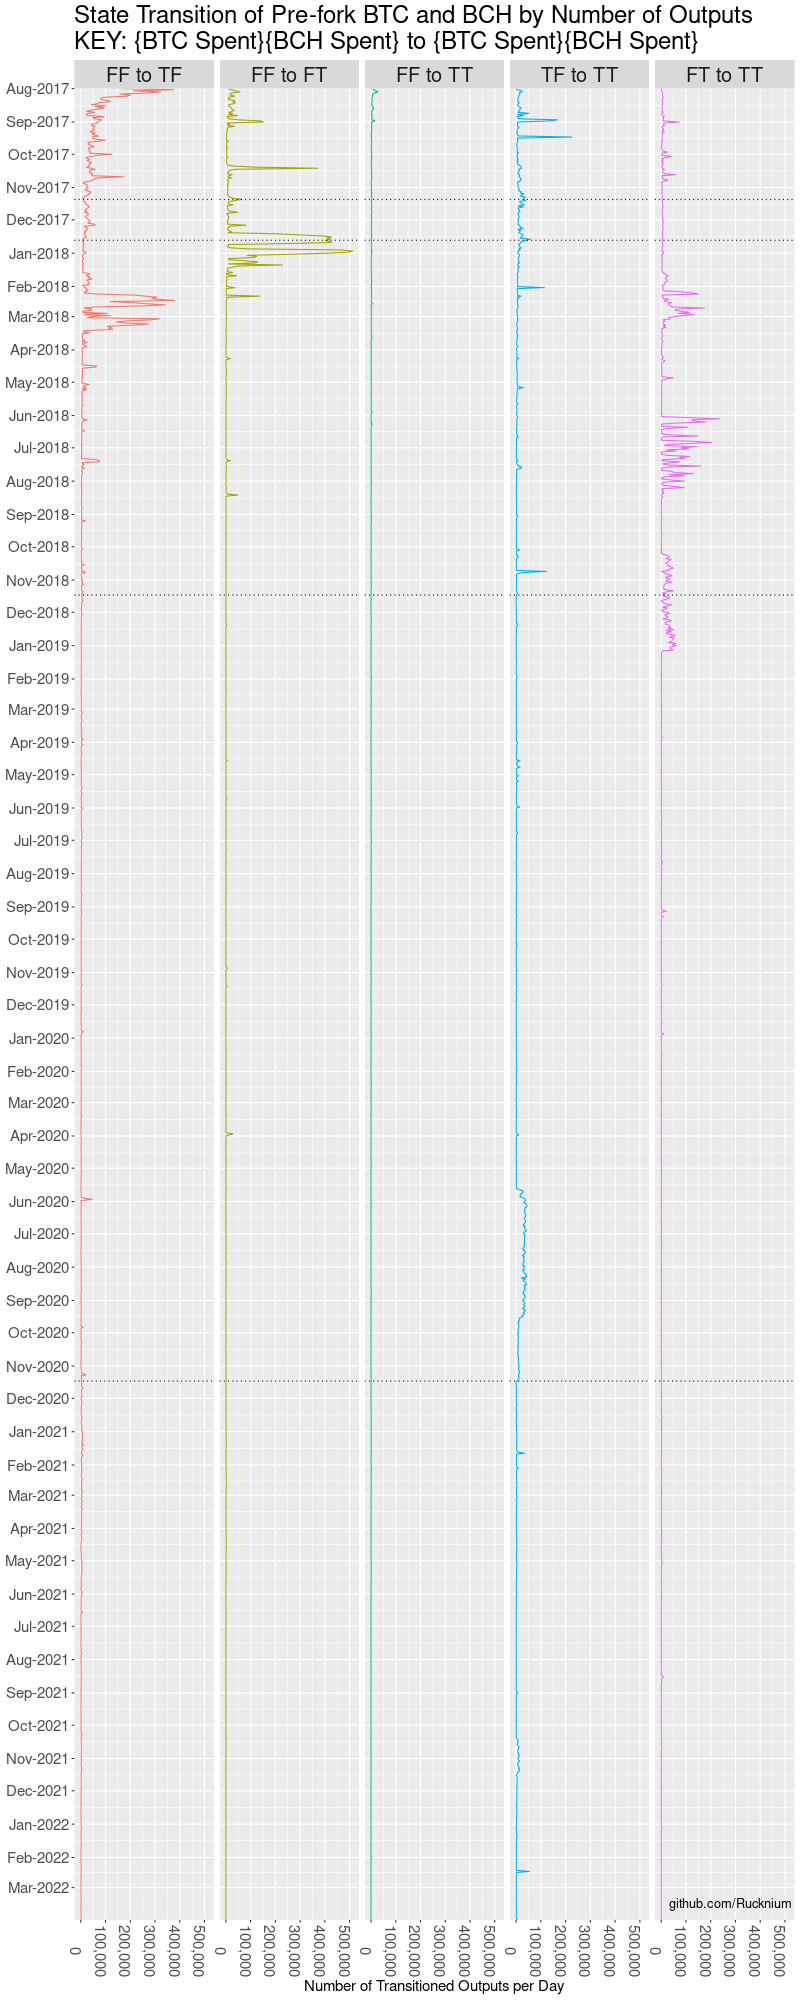
Here again we see a large number of outputs transition from FF to FT around the time when the USD/BCH exchange rate is at its highest in late December 2017. A large number of outputs were then spent on the BTC blockchain as the BTC/USD exchange rate declined in February and March 2018. Later in mid-2018, the number of outputs transitioning from FT to TT spikes, representing outputs spent on the BTC blockchain that had already been spent on the BCH blockchain. Throughout the timeline, the number of outputs that are simultaneously spent on the BTC and BCH blockchains (TT to FF) is comparatively small.
Conclusion
As expected, the highest volume of spending of pre-fork BTC and BCH occurred in the first few days after the fork. There was also a spike in spending of low-value outputs on the BCH chain around the time of maximum USD/BCH exchange rate. The great majority of pre-fork BCH has already been spent (along with BTC), so it is unlikely that a large amount of BCH is waiting to be put back into circulation.
Code to reproduce this analysis is available here. The data files are available here.