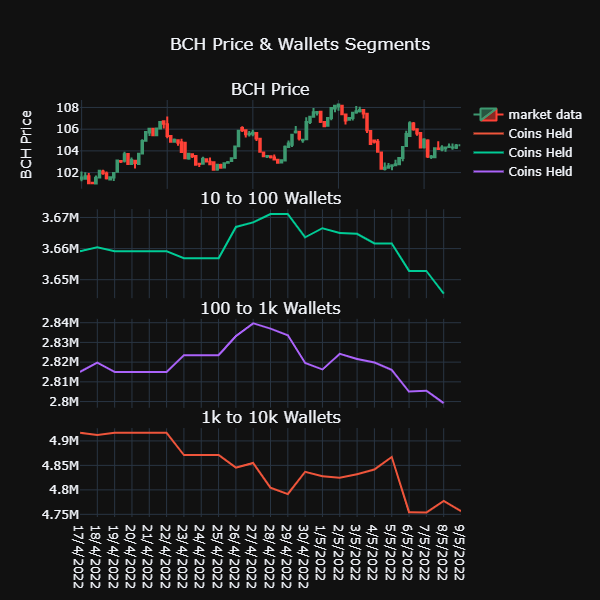
A couple of days ago I published an article about the need to use network metrics to improve decision-making in English, now I’m going to do it also in Spanish.
As you know, there are sites where you can see the real-time status of the network like (https://bitinfocharts.com/top-100-richest-bitcoin%20cash-addresses.html). This type of page is positive, but in terms of analysis it does not allow to see a clear trend of the metrics that it analyzes. That is to say that, despite having the data, if someone needed to follow the evolution of the network in, for example, the number of small 1 bch hodlers, they simply could not.
In that sense, these analyzes are useful for many areas. Like for example understanding how adoption comes. Let’s say a BCH promoter wants to know if there are many new wallets on the network that want to drink coffee, he will clearly look through the network for wallets that have less than 1 to 10 bch. What are retail wallets for daily use. There is no graph for that.
In terms of adoption, it must be clarified that although certain things are taken for granted, they are not entirely true and in fact are denied by the network itself. For example, we can assume that since Saint Kitts has a high adoption rate of BCH, the currency is very popular in the West of the planet. But trading metrics within the BCH network make it clear that the majority of trading within the network is generated within 12 hours of Asian daylight. So it is clear that the adoption in terms of volume is highest in the East of the world, Asia.
There is also an inescapable reality, as BCH grows alongside sBCH, the network will generate different types of audiences with very different interests. There will be people who will buy BCH and then acquire NFTs. Another who will buy BCH to use DEFI, another who will buy BCH to save. Another one who will buy BCH to play online. All these “new layers” of users show that BCH will eventually compete in many areas with other ecosystems to build its own “Market Share” of users within the different cryptocurrency ecosystems that are presented as an option.
Currently, in the data analysis sector, Bitcoin Cash has not created a space within the web where network data can be checked. Not at least to the level that has been generated for other networks as can be seen at (https://www.lookintobitcoin.com/charts/).
For this reason, I took on the task of beginning to investigate how to generate the data to create metrics regarding the BCH network. In a nutshell I started using IntoTheBlock’s CSV files to get plots in Plotly Python. That works, but solves little. Because nobody can access that information about BCH.
In short, I entered bitcoincashresearch.org, because the entire community could see data from bch network. But is necessary to createe a web accessible to all community.
The main goal of this article is to enlist the support of someone who understands how to data mine network data. Then you have to process that data to get the data that you require and that data will be written to a CSV every 24 hours. Then, the graphs will be made and the CSVs will be used to have the web updating in real time.
What data will the website have? stage one
First you have to generate basic data. For example, number of hodlers.
Number of Wallets that have BCH. Up to 1 BCH. 1-10. 10-100. 100-1k. 1k-10k. 10k-50k. 50k-100k. +100k.
Amount of Coins in wallets per Segment (BCH nominal network share). Up to 1 BCH. 1-10. 10-100. 100-1k. 1k-10k. 10k-50k. 50k-100k. +100k.
Dominance by % of segments: This helps to know if retailers are increasing their amount of BCH based on the % they represent in the network of the total BCH holdings.
Amount of on chain activity per volume. It measures the operations in the 12 Daytime hours between Asia and America, to give geography to the adoption.
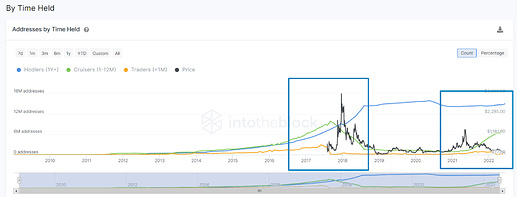
Coin Held by Time. It helps to know if users trust the network and have their BCH for the long term, as a means not only of exchange but of savings.
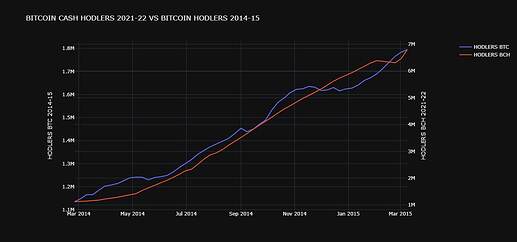
Hodlers Waves: Helps to know how the new layers of users that are received in the Bull Run evolve. That is, many users are only passing through the network. But others, stay in BCH and adopt BCH as their network. This metric is like a measure of customer loyalty.
In a second stage, metrics can be developed for Defi Apy Rates on the main Sbch platforms, Evolution of BCH transferred to sbch in the bridges. FlexUSD Apy rate evolution. Evolution of the BCH futures contracts curve in the exchanges. BCH spot volume evolution on exchanges. And other useful metrics for users as new needs are generated.

