Create an On chain Data page english

A couple of days ago I published an article about the need to use network metrics to improve decision-making in English, now I’m going to do it also in Spanish.

As you know, there are sites where you can see the real-time status of the network like (https://bitinfocharts.com/top-100-richest-bitcoin%20cash-addresses.html). This type of page is positive, but in terms of analysis it does not allow to see a clear trend of the metrics that it analyzes. That is to say that, despite having the data, if someone needed to follow the evolution of the network in, for example, the number of small 1 bch hodlers, they simply could not.

In that sense, these analyzes are useful for many areas. Like for example understanding how adoption comes. Let’s say a BCH promoter wants to know if there are many new wallets on the network that want to drink coffee, he will clearly look through the network for wallets that have less than 1 to 10 bch. What are retail wallets for daily use. There is no graph for that.

In terms of adoption, it must be clarified that although certain things are taken for granted, they are not entirely true and in fact are denied by the network itself. For example, we can assume that since Saint Kitts has a high adoption rate of BCH, the currency is very popular in the West of the planet. But trading metrics within the BCH network make it clear that the majority of trading within the network is generated within 12 hours of Asian daylight. So it is clear that the adoption in terms of volume is highest in the East of the world, Asia.

There is also an inescapable reality, as BCH grows alongside sBCH, the network will generate different types of audiences with very different interests. There will be people who will buy BCH and then acquire NFTs. Another who will buy BCH to use DEFI, another who will buy BCH to save. Another one who will buy BCH to play online. All these “new layers” of users show that BCH will eventually compete in many areas with other ecosystems to build its own “Market Share” of users within the different cryptocurrency ecosystems that are presented as an option.

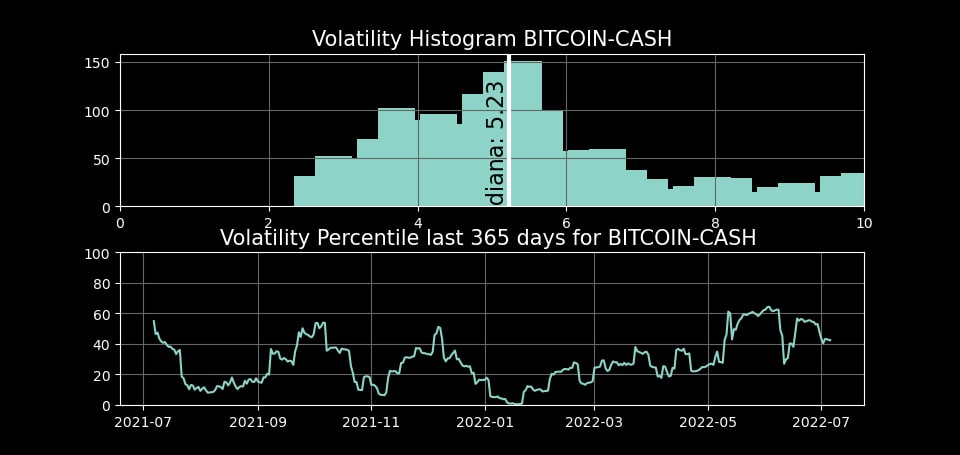
Currently, in the data analysis sector, Bitcoin Cash has not created a space within the web where network data can be checked. Not at least to the level that has been generated for other networks as can be seen at (https://www.lookintobitcoin.com/charts/).

For this reason, I took on the task of beginning to investigate how to generate the data to create metrics regarding the BCH network. In a nutshell I started using IntoTheBlock’s CSV files to get plots in Plotly Python. That works, but solves little. Because nobody can access that information about BCH.

In short, I entered bitcoincashresearch.org, because the entire community could see data from bch network. But is necessary to createe a web accessible to all community.

The main goal of this article is to enlist the support of someone who understands how to data mine network data. Then you have to process that data to get the data that you require and that data will be written to a CSV every 24 hours. Then, the graphs will be made and the CSVs will be used to have the web updating in real time.

What data will the website have? stage one

First you have to generate basic data. For example, number of hodlers.
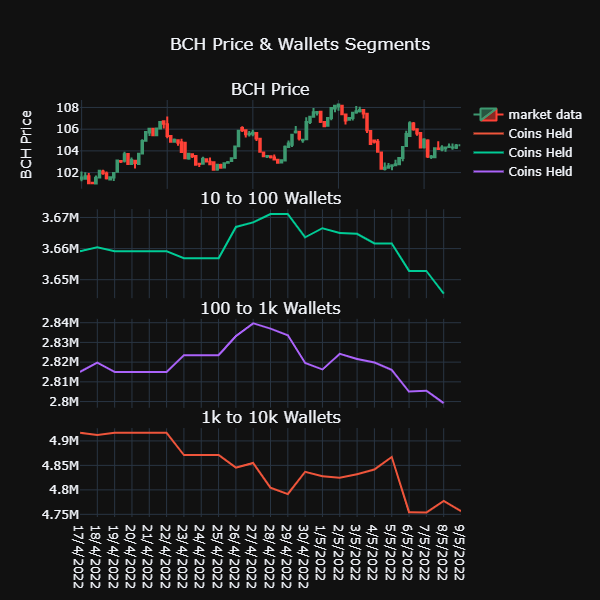
Number of Wallets that have BCH. Up to 1 BCH. 1-10. 10-100. 100-1k. 1k-10k. 10k-50k. 50k-100k. +100k.

Amount of Coins in wallets per Segment (BCH nominal network share). Up to 1 BCH. 1-10. 10-100. 100-1k. 1k-10k. 10k-50k. 50k-100k. +100k.

Dominance by % of segments: This helps to know if retailers are increasing their amount of BCH based on the % they represent in the network of the total BCH holdings.

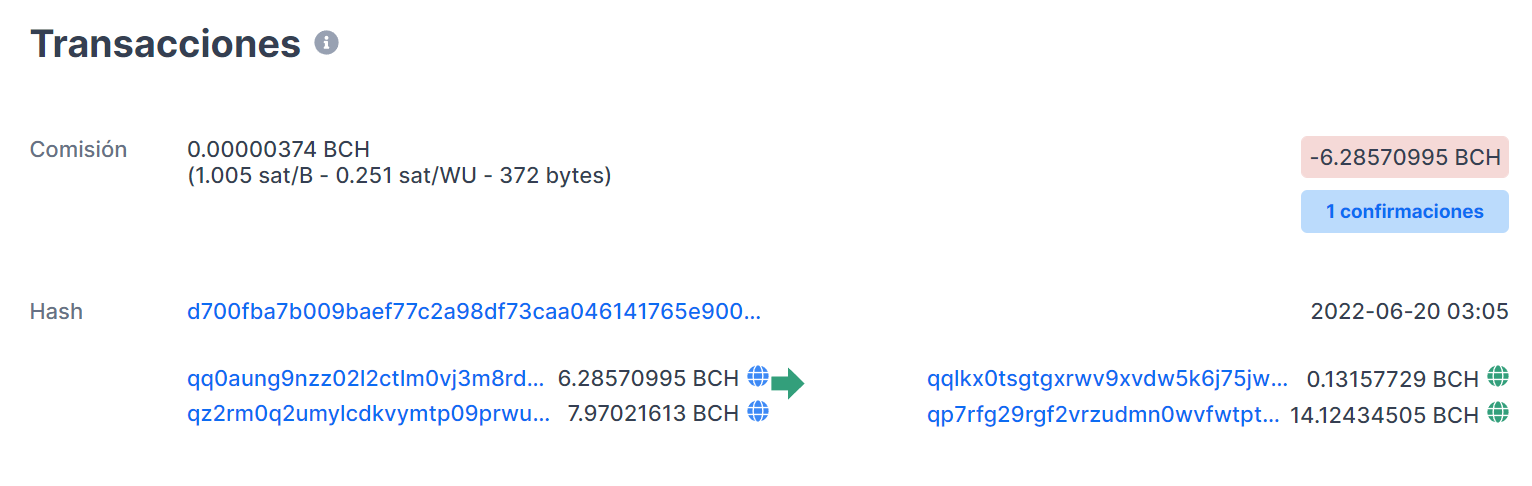
Amount of on chain activity per volume. It measures the operations in the 12 Daytime hours between Asia and America, to give geography to the adoption.

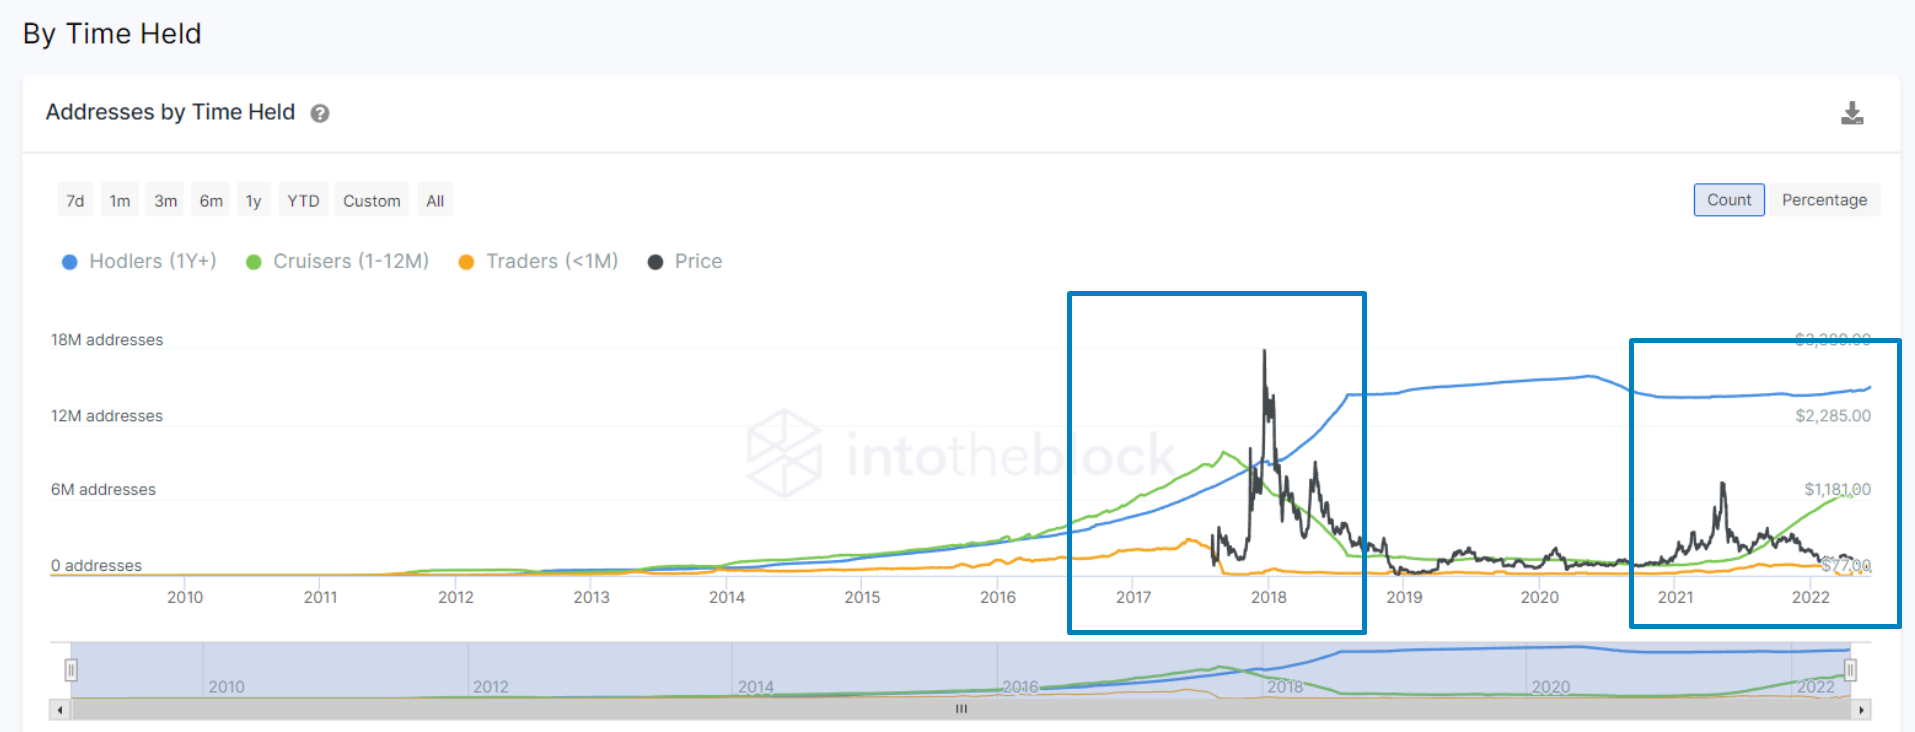
Coin Held by Time. It helps to know if users trust the network and have their BCH for the long term, as a means not only of exchange but of savings.

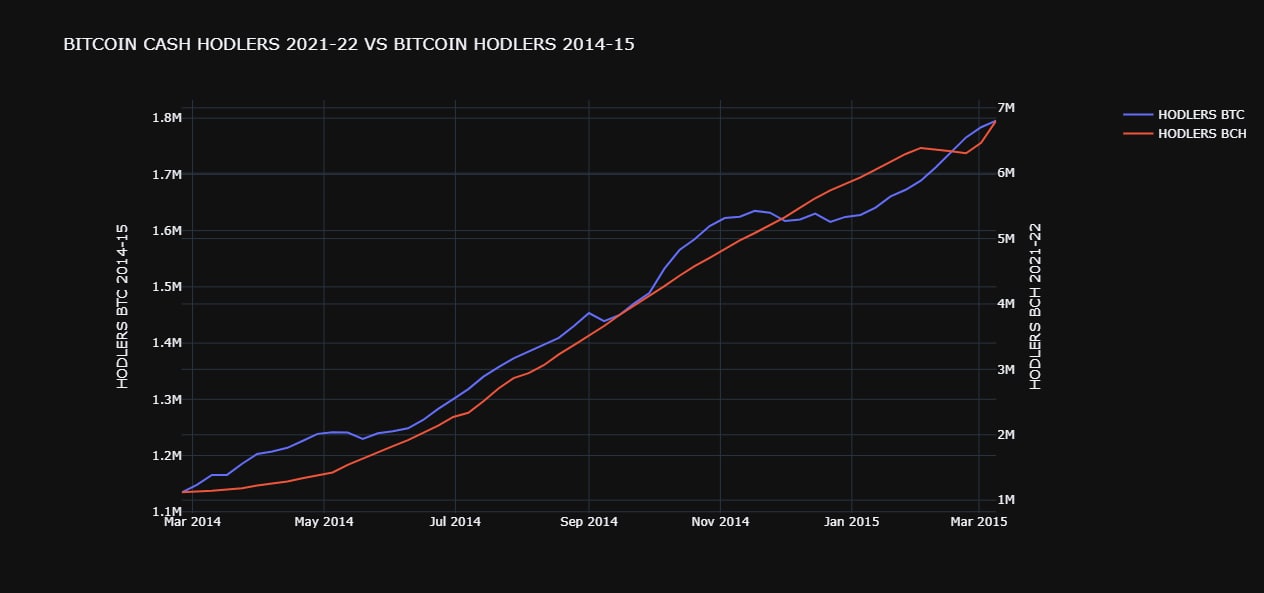
Hodlers Waves: Helps to know how the new layers of users that are received in the Bull Run evolve. That is, many users are only passing through the network. But others, stay in BCH and adopt BCH as their network. This metric is like a measure of customer loyalty.

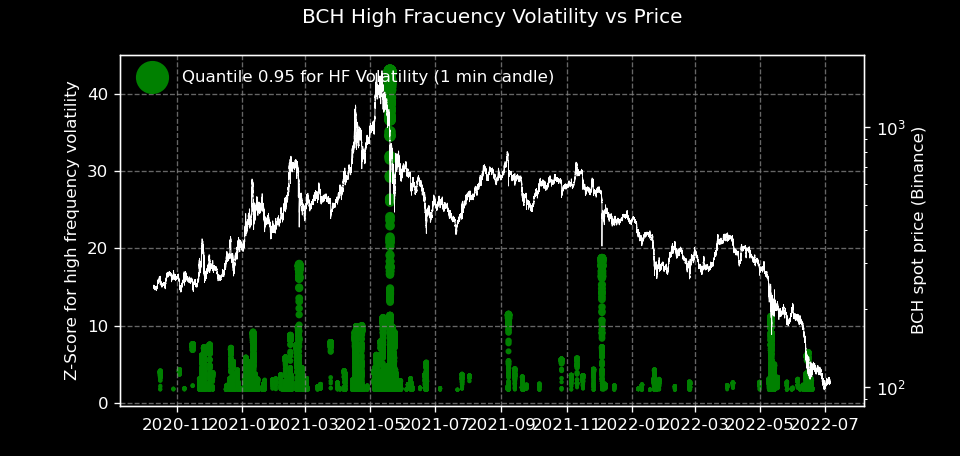
In a second stage, metrics can be developed for Defi Apy Rates on the main Sbch platforms, Evolution of BCH transferred to sbch in the bridges. FlexUSD Apy rate evolution. Evolution of the BCH futures contracts curve in the exchanges. BCH spot volume evolution on exchanges. And other useful metrics for users as new needs are generated.

2 Likes

Some data on the state of the network. As you can see, the network in its beginning shares the dynamics of growth in the segment of long and medium-term hodlers with BTC. After the fork, the dynamics underwent a change that put it at rest for a certain time. It can be called in many ways, but the interesting thing about this graph is that after the rest reset, a healthy growth dynamic has begun again in all its segments.

After obtaining the data from the first graph from IntoTheBlock, I decided to create a metric that allows analyzing the dynamics of comparative growth for a similar time segment in a period in which the price was similar. As can be seen in the resulting graph, the growth for the same period of time in terms of the number of users is much more dynamic in BCH than in BTC. It probably has a lot to do with the dynamics of acceptance of networks in general. But it also implies that the community in general and the ecosystem is in a more dynamic trend than BTC in 2014. The network is growing like it didn’t for years. Will be important to create the tools so that everyone can see based on hard data that BCH is a healthy and reliable network.

3 Likes

Yes, great initiative! The best I so far found is this: https://bitinfocharts.com/comparison/activeaddresses-btc-eth-ltc-bch.html#3y

It would be nice to have a chart for BCH UTXO set count too, I found it only for BTC: utxo-count

1 Like

I am slowly working on a Dashboard to have all the charts available. Dash App from Plotly will be used to display graphs. Attention to “Slowly” patience will be required I don’t have a programmer background so I started from scratch to “i want to build a scalable platform for BCH Network quantitative analysis”. Remember if you can help your are welcome to help. If you cannot help wish me luck it could be an epic fail since this is going to be a huge challenge. :smiley:

3 Likes

I absolutely love this initiative. I have been trying to collate sources of real, non-hype based statistics on BCH adoption and insight into the ecosystem growth at Stats | The Bitcoin Cash Podcast, starting with insight into my own available data, but I would love to have more things to link to or high quality stats.

Particularly a focus on how BTC performed pre-split with BCH now is right on trend, because narratively (anecdotally) to me it is feeling very similar - even through the broader crypto market is very different.

I can code, although I am fairly busy, but if you need some extra hands let me know and maybe we can collab a little. A stats.cash site focussed on Bitcoin Cash stats would be awesome, there’s so much to dig into now with SmartBCH as well, on the ground adoption in terms of the bitcoin.com map and more.

Edit: Also there is going to be a huge opportunity to be “the BCH stats guy” in the community, similar to Willy Woo in BTC, and that could be you haha.

2 Likes

I have been working on how to make the graphics. That has worked well. But as you know, it is necessary to do some data mining on BCH network. I would appreciate it if anyone could share a link to a book or article, to understand how to explore the network data from bch node.

Hash d700fba7b009baef77c2a98df73caa046141765e9000b63e7e73e560eb091058

For some reason, in the same trade, a direct sent from A to B does not seems to be right on the contrary, two destinations appear. And two origins on the transaction. All those things will generate inconvenience when reading the data. That needs to be understood and processed for it to be clearly charted. So i need to learn about how to handle weird blockchain data. For that i need books, articles o something that maybe someone have to share here. Random tutorials on youtube didnt worked well anyway i have to keep pushing.

I would recommend Mastering Bitcoin by Andreas Antonopoulos https://github.com/bitcoinbook/bitcoinbook for a comprehensive dive into the technicalities of Bitcoin.

This is very normal

1 Like

Thank you for your collaboration.

You had some questions about Bitcoin blockchain data model. It’s really simple once it “clicks” but it may be daunting for newcomers so I’ll post here some info.

First thing to “unlearn” is to think of an “address” as an account with balance. It can be presented that way to users, but that’s not how it works under the hood. Each “address” balance is really a collection of one-time-use “accounts” - each such account called an UTXO (unconfirmed transaction output). Every UTXO has a globally unique reference, the “key” in database terms is a composite (TXID, output index).

Every transaction spends the one-time account entirely, and moves money to brand-new one-time accounts (which can be owned by the same address, and those that “catch” the value sent back to the same address are called “change outputs”).

You had sent me this ref. on Telegram and it’s a nice one, so posting here for reference and for others: https://theblockchaintest.com/uploads/resources/SEBA%20-%20A%20Beginner’s%20Guide%20to%20Blockchain%20Accounting%20Standards%20-%202020%20-%20Jun.pdf

Also, I found that someone’s already created a nice graph for the database model: https://www.researchgate.net/figure/Relational-Database-Schema-for-Blockchain-Data_fig1_325300680

A block consists of:

  • a fixed 80-byte block header
  • count of transactions, encoded as CompactSize uint
  • raw transactions, each consisting of:
    • tx header: version
    • tx input count, followed by inputs
      - each input spends some pre-existing output (a prevout) and only the reference to the prevout is recorded in a TX that spends it, the reference is also called “outpoint”
      - input format is then: outpoint ref., unlocking script (len, bytecode), input sequence/relative lock-time
    • tx output count, followed by outputs
      - output consists of: amount and locking script (len, bytecode). That’s it. The input will later reference this and provide unlocking data that spends it (in case of standard addresses the data will be the key+signature).
    • tx footer: lock-time

The 1st transaction in a block is always the coinbase TX, and it’s the only TX that’s allowed to spend “nothing” (coinbase input, where outpoint is 0/FF) and create “something” (coinbase output with total amount defined limited by supply schedule).

That’s it really - you have your blocks, transactions, inputs and outputs. Inputs allows a pre-existing output to be consumed to create some new outputs. Every output carries a little program (Script) that says what conditions must be satisfied by the input in order for the TX to pass validation and that’s it. If you’re just analyzing amounts on different addresses - you don’t really care abut HOW the output was spent (which program was run and how it was unlocked, you don’t care about Script).

2 Likes

With what you are discussing here (great initiative btw!) I was reminded of what @Rucknium started (the rbch statistical analysis package which iirc can connect to a full node). Might be helpful for statistical analyses / extracting data / graphing etc.

2 Likes

Overall I think this is a good initiative. This paper provides a formal overview of the BTC (and therefore BCH) blockchain data structure. Here is a similar effort for Monero.

I would mainly caution that with simple tabulation of blockchain data you cannot accurately measure many of the variables that you say you want to measure. You need either more sophisticated chain analysis of the blockchain data, off-chain information such as which addresses belong to which entities, or both.

For example, the blockchain does not show wallets explicitly due to BCH’s UTXO model. It shows addresses. Therefore, an analyst must perform probabilistic address clustering techniques to estimate latent wallets. For this task, the best open source software I am aware of is BlockSci, but it is currently unmaintained. This recent paper may also be useful.

Drawing conclusions from transaction data is also tricky. It is unclear how much of the transaction volume is driven by retail transactions. For example, last year noise.cash changed how they handled tips on the BCH blockchain. The corresponding drop in transaction volume in April 2021 is apparent on the charts.

Other blockchains have similar issues with analyzing transaction volume. Until recently, Litecoin had the LiteBringer game using its blockchain to operate its game mechanics. And some researchers did this:

We present results from UWeb experiments with writing 268.21 MB of data into the live Litecoin blockchain, including 4.5 months of live-feed BBC articles, and 41 censorship resistant tools. The max-rate writing through-put (183 KB/s) and blockchain utilization (88%) exceed those of state-of-the-art solutions by 2-3 orders of magnitude and broke Litecoin’s record of the daily average block size.

I contributed to an analysis of an apparent spam incident on the Monero blockchain last year.

Even on the BTC blockchain, most transactions are related to centralized exchanges.

CashFusion transactions, which are specifically designed to conceal user behavior, are an added complication of course. In some preliminary research I estimate that about 90,000 BCH resides in the CashFusion UTXO set “pool”.

I don’t mean to discourage you, and in fact I would be willing to help a little. See some of my work on analysis of the BCH blockchain here and here. But in general it would be best to be humble (and accurate!) by not promising insights into the data that cannot be delivered.

I think a lot of “investors” enjoy looking at these types of on-chain metrics since it gives them the illusion, frankly, of control and understanding of a highly speculative asset. Cryptocurrencies have no earnings reports like traditional corporate stocks do, so people turn to the data that is available.

4 Likes

Thank you very much for offering to help with data analysis. I have seen your articles and I find them more than interesting. One of the things that seems easiest to do at the moment regarding data. It is perhaps, to have an estimate of “Balance on exchanges”. A user has sent me this wallet that he understands is from Binance. (19dQkvaH2NGgkGomzZu3qrnqRGCicXwedM)

I have tried to research Kraken and have found these wallets.

qzzklgw8yl6g4yz0t97dwqaurq6hfxx7gswk2kda02
qqjvnt5d9jkrcdy6rlmfrxe5yrqy7kujac422exym5
qqtz0ftttsl5e8c2g2s6qa35xjxfmej5agp5254gfg
qz0p7a808vjsy223quv7zdhxjyxy6q7m5yt298ahkq

These days I was digging a little more. I will try to continue with other exchanges. I suppose that once we got some wallets that we consider “high probability” of being hot wallets are identified a balance exchange, can be built.

This has to do with demystifying some speculative theories about BCH trading and having specific “estimated” numbers. It also adds some transparency and clarity regarding the actors in the ecosystem.
So I think it will be healthy for the community as well if we build it.

It is clear to me that CashFusion will create a lot of problems with data analysis it was design to mess it up. But it is necessary to have the tools to know what the state of the chain is. Beyond the vision that base users have, it is necessary to be realistic that coins are bought with money that people have earned with great effort. And that implies that it is ideal to have information about what is bought and its characteristics. That is something that a person understands when buying a vehicle or a house (having data and characteristics of the object), but it is hard for some reason to bch people to understand the importance of giving people data to choose BCH and for them make a lot sense that people choose to buy participation on random networks without any data about it. So for that reason i suppose it hasnt been developed yet, even IntoTheBlock has a lot of serious bugs in its data about bch. I was asking them to fixed it for months now.

I am adding some new information. I’ve been checking the quaterly fund balances and this address has the same behavior as the Grayscale® Bitcoin Cash Trust.

Grayscale® Bitcoin Cash Trust.
16Nmka9ftRS1ButcrQGT9aSxEZrtCua2Qs

Here I share some python code with some metrics. And some images.


Python Files seems to be no authorized

The next thing is this one. I have asked for help to a javascript dev to scrap data from bit info. And he developed this https://github.com/cleanu/bch-scraper/blob/main/getScrapData.js this is a wonderfull tool to get data from wallets segments and it create a .csv file to download for everyone here BCH Data - Google Sheets however he didnt wanted to keep working on it. I told him it need to be something that anyone can have on his pc to create csv on a descentralized way for everyone. But well didnt worked. If someone knows javascrip, seems there is a way to change that code so it create a file for the owner on his pc. I will be focus on create “easy to use”, data display free for people on python.

this new tool is created on Python Plotly and get price data and candlesticks from yahoo. While it is taking wallets movements from CSV files. For that wallets coins CSV need to be created so people can use just “play” button to see completes displays on data on a descentralized way and free.

1 Like

https://github.com/zeusunorg/BCH_Data A new repository has been created to upload and develop Data Displays and analytics on BCH.

3 Likes