Use of benchmarks in client development

The Satoshi-based clients almost all come with a suite of benchmarks for some core functions, written in C++.

In BCHN, developers are encouraged to look at the benchmarks to assess if a change they are making, is beneficial or detrimental to the performance of the application as indicated by these benchmarks.

Of course, no one is claiming that the benchmarks are perfect. They do not cover every aspect and are added to occasionally (both from our own work and upstream). They are also not normalized, so measurements obtained on one test platform should not automatically be assumed to be correlated to those taken on another.

One has to be careful about drawing conclusions from them on the overall performance impacts of a change.

My interest here is to see how we can work with the existing (limited) data, to give developers a better chance not to miss some significant performance degradation resulting from a change.

The overall approach used is to run the benchmarks on one system, with and without a change, and compare the results.

For example in this change request (MR 548), you will find some comparisons for some benchmarks that the developer is interested in (or chose based on what his inspection convinced him were the benchmarks that could be affected by his change):

Benchmark median_before median_after median_pct_change
BlockToJsonVerbose_1MB 0.0526412 0.0505036 -4.06
BlockToJsonVerbose_32MB 2.27232 2.04869 -9.84
JsonReadWriteBlock_1MB 0.049478 0.0490593 -0.85
JsonReadWriteBlock_32MB 2.15773 2.11123 -2.16
RpcMempool 0.00610431 0.00412096 -32.49
RpcMempool10k 0.0749306 0.0572924 -23.54

We see some ā€˜beforeā€™ and ā€˜afterā€™ values of the median time (in seconds) of the benchmark, and a computed percentage change (negative number means improvement).

Someone else, running the same set of benchmarks on their machine, might get different number.

Of course we are interested in a few things:

  • are the measured performance changes statistically significant, or not?
  • do the benchmarks performed accurately reflect the overall performance impacts, as far as we can tell from the limited (but larger than the above) set of benchmarks available to us?

In this topic I want to explore these questions further, and in the course of it, introduce some ā€œtoolsā€ we can use to get a better grip on these questions.

For the following, I will use data produced by running the bench_bitcoin binary produced on Bitcoin Cash Node (BCHN). In other clients, the benchmark binary may be called differently, or there may be several separate programs, but the analytical tools should apply generally.

3 Likes

As a first step, letā€™s see what data we get when running the benchmark suite (on BCHN). I will filter on a single benchmark for now to keep things brief, later we will investigate all the benchmarks.

$ src/bench/bench_bitcoin -filter=RpcMempool10k > data.txt
$ cat data.txt
# Benchmark, evals, iterations, total, min, max, median
RpcMempool10k, 5, 10, 5.3072, 0.105252, 0.107485, 0.10542

As we can see, for the ā€˜RcpMempool10kā€™ benchmark, the benchmark is run for a certain number of times comprising a number of iterations each time (evals & iterations in the column header).

By default a benchmark is run for 5 evaluations, but this can be influenced by a command line option which I did not use above.

The data indicates the total time taken, and the minimum, maximum and median time.

The developers may not have wanted to output the average execution time directly in the benchmark because it is easy to compute
from \frac{total} {evals \times iterations} .

The following little shell script usesawk to an average column, which I would like to have for later analysis.

$ cat add_average.sh
#!/bin/sh
# Add an average column to bench_bitcoin output.
awk -F, '
  /^#/ { printf("%s, average\n", $0); }
  !/^#/ { printf("%s, %g\n", $0, $4 / ($2 * $3)); }
'

Letā€™s use this on our data

$ chmod +x add_average.sh      # first make it executable
$ ./add_average.sh < data.txt
# Benchmark, evals, iterations, total, min, max, median, average
RpcMempool10k, 5, 10, 5.3072, 0.105252, 0.107485, 0.10542, 0.106144

If we want to answer the question of whether a benchmark result is significant, we have to obtain more data on the distribution of the values we are looking add (e.g. the medians or averages) by sampling them a number of times.

The following are the median and average values extracted from 31 runs of the ā€˜RpcMempool10kā€™ benchmark on my test platform.

medians:

0.105365 0.104299 0.104204 0.105975 0.104341 0.104816 0.105007 0.103584 0.105413 0.104574 0.102562 0.10503 0.103509 0.103931 0.103208 0.105849 0.103483 0.10428 0.103518 0.105337 0.104715 0.104478 0.104768 0.104409 0.104408 0.103675 0.103173 0.10542 0.104945 0.104831 0.104183

averages:

0.105425 0.104261 0.104037 0.105828 0.105 0.104818 0.104783 0.103715 0.105536 0.104669 0.102922 0.104794 0.103905 0.103786 0.103384 0.10609 0.103992 0.103972 0.103376 0.105407 0.104759 0.10439 0.104793 0.104618 0.104424 0.103737 0.103227 0.106144 0.105001 0.104828 0.104324

In the next step, we will look at how these are distributed.

2 Likes

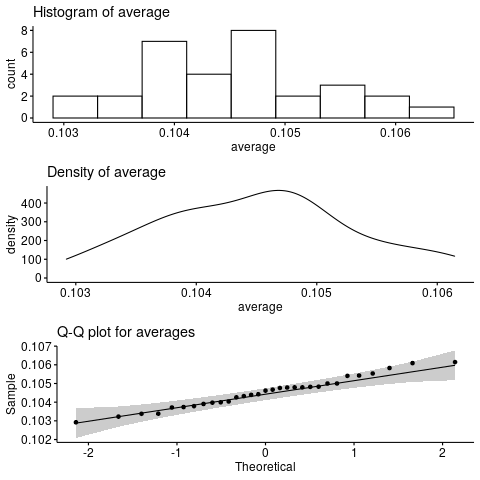
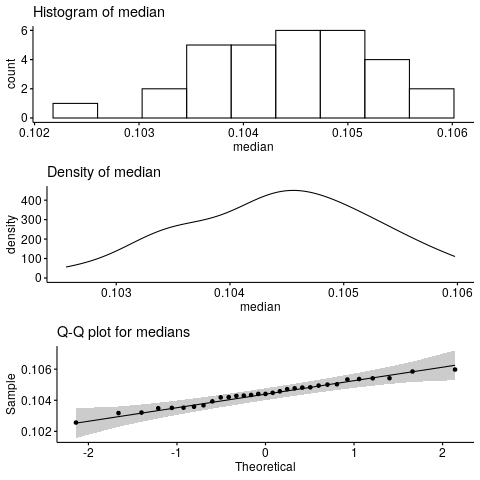
The following are histograms, density plots and Q-Q plots of the median and average samples above.

20200624_RpcMempool10k_inspection_of_median_distribution

20200624_RpcMempool10k_inspection_of_average_distribution

These were produced using the gghistogram (bins=9), ggdensity and ggqqplot functions from the ggpubr data visualization package for R.

Based on these diagrams, it looks likely that these statistics are both normally distributed for this benchmark.

We can test this in R using a normality test. The Shapiro-Wilk test was designed to test for normality for small data-size (n < 50).

For both data sets, the p-value is above 0.05 when this test is applied, indicating that we cannot reject the null hypothesis of a normal distribution.

> shapiro.test(medians)

        Shapiro-Wilk normality test

data:  medians
W = 0.9825, p-value = 0.878

> shapiro.test(avgs)

        Shapiro-Wilk normality test

data:  avgs
W = 0.97904, p-value = 0.7854

So it would seem that for RpcMempool10k benchmark, the averages and medians are normally distributed.

The next question is whether tests for normality succeed for the other benchmarks. This requires some longer runs over the whole set of benchmarks which Iā€™ve started.

If it holds then we can improve our significance tests for benchmark results by testing against normal distributions with the sampled means and variances of the above statistics.

For discussion on why the median might be normally distributed, please refer to the following excellent discussion and references contained therein:

2 Likes

In Flowee most of the C++ tests have been moved from using the (very immature) Boost library to using the QTestLib frameworks. This has the advantage that benchmarks are included and most of the things you report on doing manually are available already.

See more details here: https://doc.qt.io/qt-5/qttestlib-tutorial5-example.html

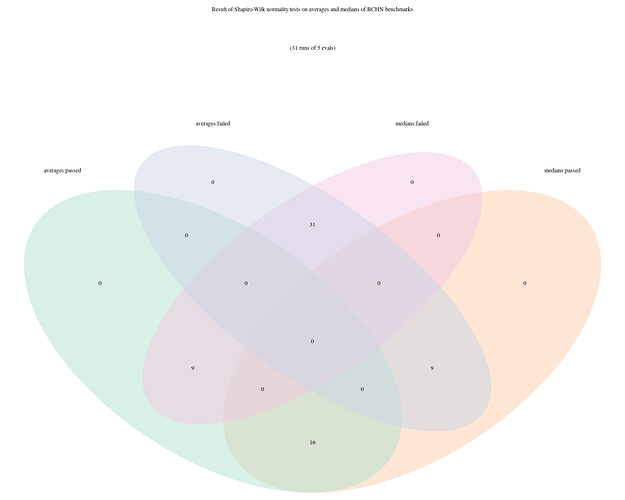
Results across the whole spectrum of benchmarks turned out to be a mixed bag in terms of distribution.

master-ecda55004b58ed418963dce983ffcc6ae1bddacb_all_benchmarks.pdf (1.1 MB)

I must have mis-constructed the PDF above only - it only includes the graphs for medians. Will provide one later on with all graphs (alternating median / average pages for each benchmark so it is easy to compare them side by side in dual page mode in a PDF viewer).